


As we write, in mid-May, 2018, the premium payable to insure oneself against equity downside risk with a one-month S&P 500 Index put option at-the-money is approximately 1.5%. Earlier this year, it was 2.0 – 2.5%. Were consistent pricing to persist, it would cost an investor 18 – 30% to maintain that exposure for a year.
Either the people buying those puts know something we don’t about an imminent major sell-off in equity markets or the people writing them are making a lot of money providing insurance. We suspect it’s the latter.
It is not hard to understand the desire to buy protection or hedge the “tail risk” in one’s equity portfolio right now. Investors have enjoyed significant gains since the financial crisis of 2008 – 09. While many remain positive on the equity markets, these investors know that trees don’t grow to the sky, and that now feels like a good time to protect those gains and funding levels.
But is a tail-risk hedging program based on buying put options an effective way to do it? We do not believe so, and in this article we will show just how ineffective—and expensive—it can be over the long term.
A Costly Option, Whichever Way You Cut It
Because puts are expensive, most investors will compromise a little on the protection they buy. They can do this in three ways. We focus on two here: allocating a smaller budget to the program and accepting that a smaller part of the equity-portfolio value will be notionally covered by the “insurance”; and/or by selecting out-of-the-money puts, leaving the portfolio exposed to the first part of any market sell-off, until the index falls below the strike prices of the options. The third way is to sell call options, or create so-called “put spreads” by buying puts at different strike prices, to help finance expensive puts—these strategies are beyond the scope of this article, but in our view, a hedging solution that creates a problem that requires another solution is not really a solution.
Unfortunately, neither of the first two approaches makes a substantial difference to an investor’s long-term outcome. We show this in figure 1.
Consider what happens when you deploy 1% of your overall equity allocation toward a budget to hedge with two-month puts—in other words, you are prepared to spend $1m per year to protect a $100m equity allocation. We assume that the options are held to expiry and then settled for cash if they have value.
Buy at-the-money puts (100% “moneyness”) and you know that as soon as the market falls your options have value. On the other hand, you can afford to cover only 7% of your equity allocation. Over the 28 years between 1990 and 2018, which included the Asia and Russia crises of 1997 – 98, the dotcom crash and the 2008 – 09 financial crisis, on average you would have given up $400,000 of the $1m you spent on insurance each year.
To put it another way, spending $1m per year on put options occasionally paid off, but over time the expected value of purchasing puts was negative $400,000—the premiums you spend exceed the offsetting profits. In exchange for that, you would have been exposed to 97% of the market downside and your maximum drawdown would have been approximately -54%. Over the same period, the maximum drawdown for the S&P 500 Total Return Index was -55%.
The point of a hedging program is to get a hedge. Accepting 97% of the downside does not seem very hedged.
Figure 1. Nb Model Results Obtained With Different Hedging Budgets, and Puts of Different Moneyness
Equity Allocation = S&P 500 Option = 2-Month Puts on S&P 500
Using 1.0% of equity allocation to buy 2-month tenor S&P 500 put options
| Moneyness | Notional Coverage Achieved | Annualized Effective Cost | Up Market Capture | Down Market Capture | Maximum Drawdown |
|---|---|---|---|---|---|
| 100% | 7% | -0.4% | 97% | 97% | -54% |
| 94% | 21% | -0.5% | 96% | 96% | -54% |
| 85% | 55% | -0.4% | 96% | 97% | -52% |
Using 0.5% of the equity budget to buy 2-month put options
| Moneyness | Notional Coverage Achieved | Annualized Effective Cost | Up Market Capture | Down Market Capture | Maximum Drawdown |
|---|---|---|---|---|---|
| 100% | 3% | -0.2% | 98% | 98% | -55% |
| 94% | 10% | -0.2% | 98% | 98% | -54% |
| 85% | 27% | -0.2% | 98% | 98% | -54% |
Source: Neuberger Berman. For illustrative purposes only. Based on a hypothetical back-tested model, between January 1990 and March 2018. Market capture data is averaged over the whole period and based on daily returns. Please see important disclosures at the end of this paper.
Do Out-of-the-Money Puts or a Smaller Hedge Budget Help?
What would have happened had you bought puts 6% out-of-the-money (94% moneyness)? Your $1m per year would have covered 21% of your equity allocation rather than just 7%. But you would have still taken 96% of the down markets, your maximum drawdown would have been the same and, because you were not protected against the first six percentage points of any sell-off, the long-term effective cost would have been greater: on average you would have given up $500,000 of the $1m you spent on insurance each year. Even buying 15% out-of-the-money puts would not have made much difference.
What would the results have been had you spent less on the program? Let’s say you spent $500,000 rather than $1m per year, or 0.5% of your $100m equity allocation. Based on our conversations with investors, that sort of budget is more realistic.
Unsurprisingly, you covered only half as much of your equity allocation (3%), and you were exposed to 98% of the market downside and had a maximum drawdown of -54%. You got a better result overall, in the sense that you only gave up $200,000 of the $500,000 you spent on insurance each year—but it still seems odd to pay $200,000 a year for downside protection that leaves you with 98% of the market downside and essentially the same maximum drawdown as the equity index (once dividends are taken into account).
Deploy one- or three-month put options and the results barely change. It is easy to conclude that the long-term results of a tail-risk hedging program based on buying put options do not justify the costs.
One objection to this conclusion would be that no one implements these programs on a long-term basis. But to do so tactically involves very precise market timing: an investor needs not only to buy its put options before a big sell-off occurs, it also needs to sell them before they expire or cross back out-of-the-money. If you can do that, why use options? Simply avoid paying insurance and time the market by reducing or increasing overall equity risk. No matter what way you look at it, buying put options appears to be a short-term and, dare we say, speculative endeavor.
Does Using Long-Dated Puts Help?
It is true that options with long tenors—12 months or more—tend to be cheaper, on a day-by-day basis, and operationally easier to manage than continually rolling shorter-dated, one-, two- or three-month puts. Perhaps that is a more efficient way to maintain a tail-risk hedge?
Unfortunately not. In fact, as we show in figure 2, holding a 12-month put can end up being more costly than rolling short-dated options over the same period.
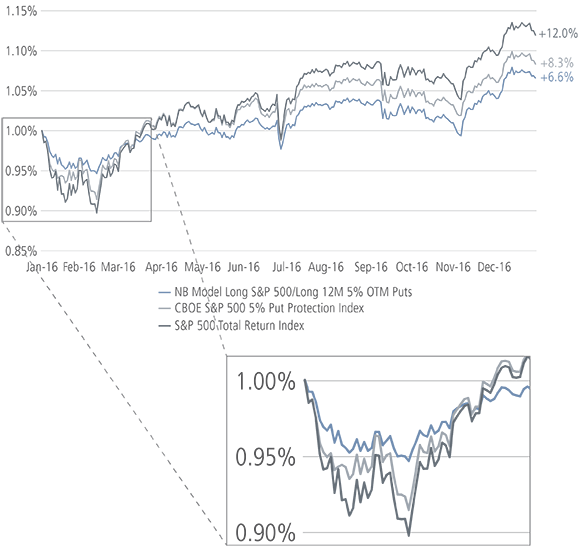
We look at the performance of three different portfolios through 2016, whose first few weeks experienced a 10% drawdown in the S&P 500:
1. The S&P 500 Total Return Index
2. The CBOE S&P 500 5% Put Protection Index (which consists of a long-S&P 500 position paired with a rolled position in one-month, 5% out-of-the-money puts)
3. A long-S&P 500 position paired with a 12-month, 5% out-of-the-money put option with the same notional value as the S&P 500 allocation, held to expiration
Figure 2. A Long-dated Put Option Can End Up More Costly Than Rolling Short-dated Positions
Put option protection during the calendar year 2016
Source: Neuberger Berman. For illustrative purposes only. Based on a hypothetical back-tested model, between January and December 2016. Please see important disclosures at the end of this paper.
By the end of the year, the S&P 500 Total Return Index was up 11.96%. The holder of the CBOE S&P 500 5% Put Protection Index (the hedge using rolling 5% out-of-the-money, one-month puts) ended up 8.33%, having given away 3.6 percentage points in insurance costs. The hedge cost 6.4% in aggregate across 12 consecutive months and had a few short-term payoffs totalling 2.8%, leaving the net total cost of the hedge at 3.6%. The investor who purchased the 12-month put upfront spent 5.4% on insurance (that’s $5.4m upfront to hedge $100m in exposure!) but had no value upon expiration, leaving the total cost of the hedge at 5.4%. (For comparison, as of April 17, 2018, a 12-month, 5% out-of-the-money put on the S&P 500 Index cost roughly 4.4% upfront through March 29, 2019.)
While it is true that the long-dated puts offered more protection at the worst point of the sell-off in February 2016, the advantage was very fleeting—by the end of February, all of the options were back out-of-the-money. It is classic hindsight to claim that one would have taken profits from the hedge at just the right time, but in reality that rarely happens. For most investors, loss aversion kicks in, and hedges with significant time to expiration are rarely taken off at the just the right time. Without that skill of timing the market, maintaining long put option positions is very costly, and that should not surprise us; after all, equity markets do tend to rise in value over the long term.
Don’t Chase Your Tail
Either hedging strategy, using long-dated or short-dated options, may outperform the other in any given year depending on the path of the S&P 500. Over the long term, however, both have burdened investors with costs. Option markets typically are not in the business of losing money from selling investors insurance on portfolios any more than real insurance companies are in the business of losing money from insuring houses or lives. There are ways to address the challenge of down markets with options strategies, but in our view, simply buying and holding put options, whether short- or long-dated, at-the-money or out-of-the-money, is not one of them.


